Before you dive in, it’s important to remember that no one can know for sure what is going to happen in the crypto market.
The media, influencers, traders and governments, can have a sudden and dramatic influence on crypto prices.
In a bullish crypto market, demand will reduce the supply of coins for sale and the price will increase.
When the price goes up, the market becomes bearish, as traders try to capitalise by selling their coins and as they sell, supply will outweigh demand, causing the price to go down again.
In the crypto market, course corrections can happen within hours and are what you should be looking for, if you want to make a profit.
However if you are looking for longer term wins, then you should look at general upward and downward trends, so as not to panic and sell at a downturn price, which might actually be just a natural price correction.
Examine the price charts and graphs of the currencies you are interested in and look for consensus within that information.
The more volatile the market may be, the higher your potential gain or loss over the course of a day.
The Candlestick

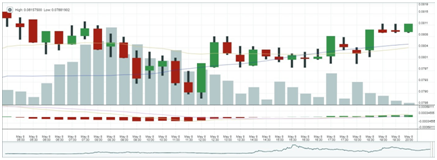
If you are looking at the price of a coin during the day, the coloured rectangle in each candlestick shows the difference between the opening balance and the closing balance.
Green means that the value of your coin has increased that day.
When the candlestick is green, the bottom shows the opening price and the top will show the closing price.
If the candlestick is red, the value of the coin went down during the day.
The “wicks” on the top and bottom of each candlestick, show the highest and lowest range of progress within a day.
This is very useful data because it shows how volatile the market is within a 24 hour period (not just the opening and closing price).
If the wick at the top of a candle is very short, this suggests that a coin price is increasing and it has ended the day, close to its highest price for the day.
If the wick is long, it shows that during the day’s trading, the price was much higher, but people were selling it to make a profit.
If the wick at the bottom of a candle is short, it suggests that people are still selling the currency and that there is ample supply and the price may go down even further.
However if the wick at the bottom of the candle is long, it suggests the price has already dipped and people are buying it, hoping to get it at its lowest price.
If a candlestick on one day, is smaller than the day before (including its wicks) and fits within the range, it is referred to as an “inside bar”. It can be a sign of the market consolidating.
If you have a second day of inside bars, it may be a sign of the market tightening and a breakout may occur.
A breakout is a spike in trading volume (either up or down) and they always tend to be big.
If you notice a period of tightening and then the next candlestick exceeds the predecessors’ range and is not an inside bar, this is probably an indication of a breakout.
If it exceeds the high point, it will be a bullish breakout and if it dips below the point, it will be a bearish breakout and if backed by a big shift in trading volume, it could be the indicator of a significant price shift.
Volume
There are two types of volume to consider with crypto trading.
One is the actual volume of sales, which is how many coins were traded in the period you are looking at and then the dollar volume, for that specific period.
The volume (amount of coins traded) will often appear as a column at the bottom of a price chart.
The height of the column identifies the volume and the colour indicates if the volume was more bearish or bullish.
Volume is an indicator of how bullish or bearish the market is and generally, the larger the volume of trade, the bigger the price volatility.
Volatility is a good thing for traders because it presents an opportunity to buy at a low price and sell at a higher price.
Volume can often be an indicator of whether or not a trend will continue to be bullish or bearish, over an extended period of time.
When trading volumes are high and the price of a coin is increasing, if you are thinking of selling, it may pay to wait, with the expectation that the upward movement will continue and possibly buy more coins.
Don’t ever just look at one indicator but rather, look at patterns across a number of indicators.
For instance, a large spike in volume of transactions, combined with a long wick at the top of a candlestick, indicates that the price is not being driven upward and the bears are starting a downward trend, so it may be a good time to sell.
If overall, the volume of trades is low, it may suggest that there isn’t much confidence in the market, so any changes in price is probably not likely to continue into the next period.
Big spikes in volume can occur around a big announcement and can have a significant effect on a coin’s price, so pay attention.
The dollar volume for a period, relates to the price of the coin, multiplied by the volume traded. This enables traders to compare different currencies.
For instance a spike of a million sales of a currency only worth $1 is not the same as a spike of 100,000 trades of a coin worth $200.
Moving Averages
It also pays to look at price movements over a large section of time (days, weeks and months).
Generally, with Moving Averages, the longer the period examined, the stronger the indicator.
Traders tend to use these metrics to set buy and sell limits on coins, which are pre-determined smart contracts that are set up within the exchange and will be activated automatically, without human intervention.
There are two types of moving averages to consider when you are looking at price graphs- The Simple Moving Average and the Exponential Moving Average.
The SMA displays the average closing price over a set period of time and shows a trend over time and takes more of a holistic view, of the currencies performance.
Unlike the SMA, which divides the closing balance of each day equally and divides it by 7, the EMA gives more weight to the previous day and is more of a reactionary metric.
Moving averages can also help show the patterns, in relation to buying or selling at a certain price point.
For instance, if a closing price doesn’t go past a moving average, it may suggest a resistance in the market at that point.
Conversely, if the price gets past a moving average, it may suggest a bullish market and could be a good opportunity sell.
If the closing price doesn’t dip below a moving average, it may suggest a momentum in people buying at that particular price.
If the price does dip below the moving average, it may suggest a downward trend in which people may start buying.
Relative Strength Index
The RSI looks at the momentum in a currency’s trading history and is represented by a scale of 1 to 100 and looks back over 14-day periods, to establish its number.
The RSI is a moving indicator, that is established by looking at the gains over a 14 day period and divided by the average losses- so each new day is a 14 day period, with the oldest day, dropping out and the most recent one, is then included in the indicator.
Currencies become overbought, if there is an extended period of gains and oversold, if there is an extended period of losses.
Generally, a currency is considered overbought, if the RSI is past 70 and oversold if it is below 30.
It is considered that the market is ready for a natural correction at the extremes of the RSI, which can add to the argument that there will be a reversal in the market.
Arbitrage
Different crypto exchanges can sell coins at different rates.
If you have the capacity to act swiftly, you can make money buying a coin at a cheaper rate at one exchange and selling it on another exchange, that is listing the coin at a higher price.
This is called arbitrage and it is the difference, between the two cryptocurrencies on different exchanges.
There are fees for these transactions and there may be delays, waiting for the transaction to be confirmed on the blockchain.
Disclaimer: This is not a recommendation to trade. Cryptocurrencies involve significant risk and are highly volatile and can be subject to secondary activity. Consider your own circumstances and obtain your own advice. Always verify the nature of currency or service, paying special attention to its legal status and regulatory requirements.


